
Sunday, October 07, 2007
The Superferry public survey game--how to lie with statistics
There are now two surveys of public opinion on the Superferry fiasco. Both are deeply flawed and manipulative. And one was done by a newspaper, which should know better, if it wants to be respected as an unbiased source of information.
The press is rightly criticized for not asking the hardball questions. Whether it is President Bush claiming that Iraq has weapons of mass destruction or the Superferry announcing the results of a survey it paid for, claims should be checked and researched.
The first survey was arranged by the public relations firm representing Hawaii Superferry Inc., so its impartiality is suspect right from the start. Although at least one legislator has requested a copy of the survey and protocol, I'm not aware that it has been released.
Details of the survey have been hard to come by. Today's Honolulu Advertiser story is the first I have seen to break down the numbers according to island. It seems that only fifteen people were surveyed on Kauai (count 'em, 15!) and only 30 on Maui. The population of Kauai (2006) is about 63,000 and the population of Maui (2006) is about 141,300, so the sample is 0.02% of the population in each case.
What they didn't tell you is that the margin of error for this survey would be about 25% for Kauai and 18% for Maui. The sample size is pathetically too small.
In designing a survey you need to be able to generalize your sample to the entire population, so it cannot be too small. In other words, in my humble opinion, this survey is crap.
I haven't seen the questions yet, and a lot rides on what they were and how they were asked. For Oahu residents, a ride on the Superferry represents a holiday. For Neighbor Island residents, it could mean an invasion.
We also don't know if surveyors quoted the cost to ride the ferry. The answers would be a lot different if respondents knew what the fare was. This is an illustration of how surveys can be used to lie. "Do you wanna ride the ferry?" for example, would produce great results for the ferry company to shout about, but is poor science.
This morning, the Star-Bulletin released the results if its survey. 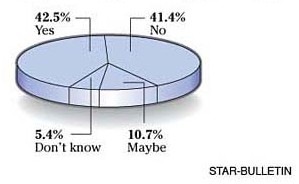
The first question is, Do you think an environmental assessment should be done on the Superferry?
There are a couple of problems with this. First, the question does not indicate that the environmental assessment is required by state and federal law. The question doesn't explain that a judge has determined an EA is necessary. This leads respondents to think it is optional, and that they can choose freely. The law is already well established, so the question is misleading. This is a common way of skewing a survey—give people a false choice.
Next, take a look at the Star-Bulletin's presentation of the data in the funny pie chart above. The chart has been slanted and rotated and even shaded to obscure the data! Notice how the "No" section looks bigger than the "Yes" section. A pie chart, even drawn 2-dimensionally as it should have been, can be easily rigged to distort the data.
By failing to separate out replies from the Neighbor Islands, the presentation of the data has allowed Oahu to dominate. Same as the survey paid for by the Superferry corporation.
Other Star-Bulletin questions are also problematic.
"Do you consider the Superferry running into a whale a problem?" This is not a properly constructed question. If the Superferry ran into one whale, would that be a problem? The issue is not whether a single whale is run into, but whether lots of whales are endangered. More important, the paper shows the answer divided into "Big problem," "Small  problem," "Not a problem," and "Don't know". So the question asked was different than has been presented in the article. It's not just Yes or No, the responses have been divided further at the expense of the "Yes" question. And just what is "Big" and what is "Small?"
Those who responded overwhelmingly thought it was a problem, but the presentation makes you think that most thought it was a "Small problem" (look at the pie chart!) This is a gross distortion. Only 40% thought it was not a problem. On Maui, only 26.7% thought it was not a problem, and on Kauai only 35.3% thought it was not a problem.
Similarly, the traffic congestion question, even with 50% of Oahu residents responding "Not a problem," is otherwise overwhelmingly that it is a problem. The article's interpretation hides this. The same job has been done on the invasive species question.
On these last two, Neighbor Island residents suffer the traffic congestion and invasive species, but their responses were allowed to be swamped by the Oahu results and the splitting of the positive response into "Big" and "Small." Just as an example, for someone on the North Shore of Oahu responding to the traffic congestion question, the extra traffic added by the Superferry (or a hundred Superferries) makes no difference. The cars will be lining up elsewhere. When that ferry arrives on Kauai and discharges its passengers and cars, the single road has to bear the entire brunt of the traffic impact.
So people on Oahu unlikely to see the traffic as a problem were allowed equal weight with those who are deeply affected. Knowing this, the paper lumped the data together, guaranteeing that Neighbor Island results would be suppressed in comparison. The error here is that unaffected people were used to swamp the replies by those affected. They might as well have surveyed residents of Indianapolis and thrown their responses into the results.
No doubt these surveys will be hauled out to encourage the Legislature to convene a special session. I hope, should that occur, that they at least call a research methodologist to testify on the validity of both of these surveys.
Don't you hate it when people deliberately use numbers to manipulate your opinion? I do.
Remember also that the daily papers withheld the information about the governor's threats of arrest just before her meeting 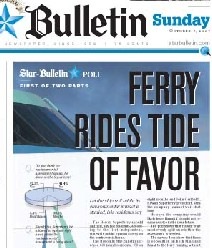 with Kauai residents, yet highlighted the loud protests she received in return. We need to have better reporting if we are to be truly informed on this issue.
The Star-Bulletin has shown its bias not only in the conduct of its survey but in its front-page hype. No, there is no "tide of favor." They've just asked their questions of people chosen to agree with their point of view, then rigged the presentation to distort the results.
As to the "tide of favor," if they looked in the water they'd see it is full of protest, not friends bearing welcoming gifts.
 : 10:24 PM HST
 i read the bulletin story, and just when "pesha! fricking yellow journalists!" i knew there was something wrong with the survey -- just by virtue of the fawning, absolutist headline -- but i really didn't want to devote any time to actually thinking about the article's flaws.
thanks.

I would agree with you that the aggregated statewide results might obscure more than they reveal. I very much appreciated that the results are broken out by county - it makes them much more meaningful.
I differ with you on your critique of breaking out some answers into 'big problem,' 'little problem,' 'no problem.' It is usually considered "better" when a survey provides a range of answers rather than limiting respondents to a two dimensional 'yes' or 'no' choice. The results are more meaningful when choices representing a middle ground are not eliminated.
I don't doubt that the article, which I haven't read, might be completely slanted, but I don't find the survey instrument itself to be grievously one-sided or unfair.
Links to this post:
<< Home
![]()


Post a Comment